Get the Competitive Edge with EZGovOpps Spend Charts
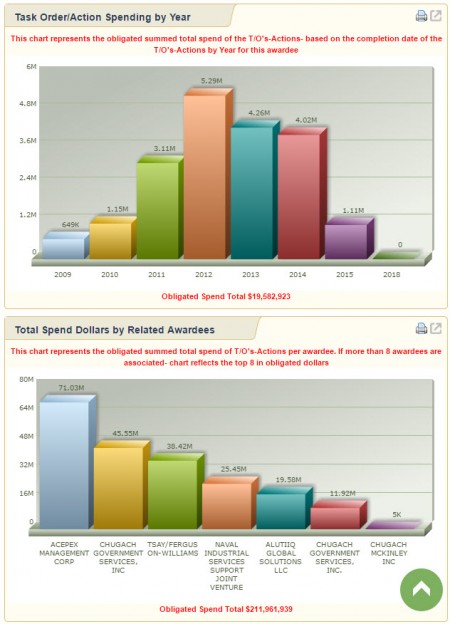
Subscribing to EZGovOpps at the Silver or Gold level gives you complete access to valuable information, including a number of visual charts. One chart represents obligated total spend of task order actions based on the completion date of task order actions by year per awardee. The other chart represents the obligated total spend of task Actions per awardee (up to the top eight awardees).
Consider upgrading your account to get access to these important charts, as well as other critical information such as proprietary analyst updates, pre-forecast RFPs, GWAC/Schedule/Program-IDIQ information, and much much more. We’d be happy to work with you to pro-rate the difference should you or your company wish to upgrade.


